

Letter/Comment
April 2022
Hospitals are experiencing significant increases in expenses for workforce, drugs and medical supplies
For over two years since the outset of the COVID-19 pandemic, America’s hospitals and health systems have been on the front lines caring for patients, comforting families and protecting communities.
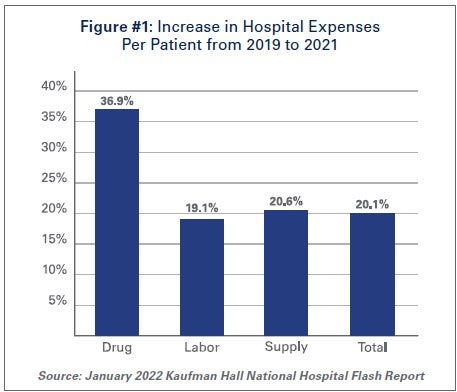
With over 80 million cases1, nearly 1 million deaths2, and over 4.6 million hospitalizations3, the pandemic has taken a significant toll on hospitals and health systems and placed enormous strain on the nation’s health care workforce. During this unprecedented public health crisis, hospitals and health systems have confronted many challenges, including historic volume and revenue losses, as well as skyrocketing expenses (See Figure #1).
 Hospitals and health systems have been nimble in responding to surges in COVID-19 cases throughout the pandemic by expanding treatment capacity, hiring staff to meet demand, acquiring and maintaining adequate supplies and personal protective equipment (PPE) to protect patients and staff and ensuring that critical services and programs remain available to the patients and communities they serve. However, these and other factors have led to billions of dollars in losses over the last two years for hospitals, and over 33% of hospitals are operating on negative margins.
The most recent surges triggered by the delta and omicron variants have added even more pressure to hospitals. During these surges, hospitals saw the number of COVID-19 infected patients rise while other patient volumes fell, and patient acuity increased. This drove up expenses and added significant financial pressure for hospitals. Moreover, hospitals did not receive any government assistance through the COVID-19 Provider Relief Fund (PRF) to help mitigate rising expenses and lost revenues during the delta and omicron surges. This is despite the fact that more than half of COVID-19 hospitalizations have occurred since July 1, 2021, during these two most recent COVID-19 surges.
At the same time, patient acuity has increased, as measured by how long patients need to stay in the hospital. The increase in acuity is a result of the complexity of COVID-19 care, as well as treatment for patients who may have put off care during the pandemic. The average length of a patient stay increased 9.9% by the end of 2021 compared to pre-pandemic levels in 2019.4
As hospitals treat sicker patients requiring more intensive treatment, they also must ensure that sufficient staffing levels are available to care for these patients, and must acquire the necessary expensive drugs and medical supplies to provide high-quality care. As a result, overall hospital expenses have experienced considerable growth.
Data from Kaufman Hall, a consulting firm that tracks hospital financial metrics, shows that by the end of 2021, total hospital expenses were up 11% compared to pre-pandemic levels in 2019. Even after accounting for changes in volume that occurred during the pandemic, hospital expenses per patient increased significantly from pre-pandemic levels across every category. (See Figure #1)
The pandemic has strained hospitals’ and health systems’ finances. Many hospitals operate on razorthin margins, so even slight increases in expenses can have dramatic negative effects on operating margins, which can jeopardize their ability to care for patients. These expense increases have been more challenging to withstand in light of rising inflation and growth in input prices. In fact, despite modest growth in revenues compared to pre-pandemic levels, median hospital operating margins were down 3.8% by the end of 2021 compared to pre-pandemic levels, according to Kaufman Hall. Further exacerbating the problem for hospitals are Medicare sequestration cuts and payment increases that are well below increases in costs. For example, an analysis by PINC found that for fiscal year 2022, hospitals received a 2.4% increase in their Medicare inpatient payment rate, while hospital labor rates increased 6.5%.5
These levels of increased expenses and declines in operating margins are not sustainable. This report highlights key pressures currently facing hospitals and health systems, including:
Each of these issues separately presents significant challenges to the hospital field. Taken together, they represent conditions that would be potentially catastrophic for most organizations, institutions and industries. However, the fact that the nation’s hospitals and health systems continue to serve on the front lines of the ongoing pandemic is a testament to their resiliency and steadfast commitment to their mission to serve patients and communities around the country.
Hospitals and health systems are the cornerstones of their communities. Their patients depend on them for access to care 24 hours a day, seven days a week. Hospitals are often the largest employers in their community, and large purchasers of local services and goods. Additional support is needed to help ensure hospitals have the adequate resources to care for their communities.
The hospital workforce is central to the care process and often the largest expense for hospitals. It is no surprise then that even before the pandemic, labor costs — which include costs associated with recruiting and retaining employed staff, benefits and incentives — accounted for more than 50% of hospitals’ total expenses. Therefore, even a slight increase in these costs can have significant impacts on a hospital’s total expenses and operating margins.
As the pandemic has persisted for over two years, the toll on the health care workforce has been immense. A recent survey of health care workers found that approximately half of respondents felt “burned out” and nearly a quarter of respondents said they anticipated leaving the health care field.6
This has been mirrored by a significant and sustained decline in hospital employment, down approximately 100,000 employees from pre-pandemic levels.7 At the height of the omicron surge, approximately 1,400 hospitals or 30% of all U.S. hospitals reporting data to the government, indicated that they anticipated a critical staffing shortage within the week.8 This high percentage of hospitals reporting a critical staffing shortage stayed relatively consistent throughout the delta and omicron surges.
 The combination of employee burnout, fewer available staff, increased patient acuity and higher demand for care especially during the delta and omicron surges, has forced hospitals to turn to contract staffing firms to help address staffing shortages.
Though hospitals have long worked with contract staffing firms to bridge temporary gaps in staffing, the pandemic-driven-staffing-shortage has created an expanded reliance on contract staff, especially contract or travel registered nurses. Travel nurses are in particularly high demand because they serve a critical role in delivering care for both COVID-19 and non-COVID-19 patients and allow the hospital to meet the demand for care, especially during pandemic surges.
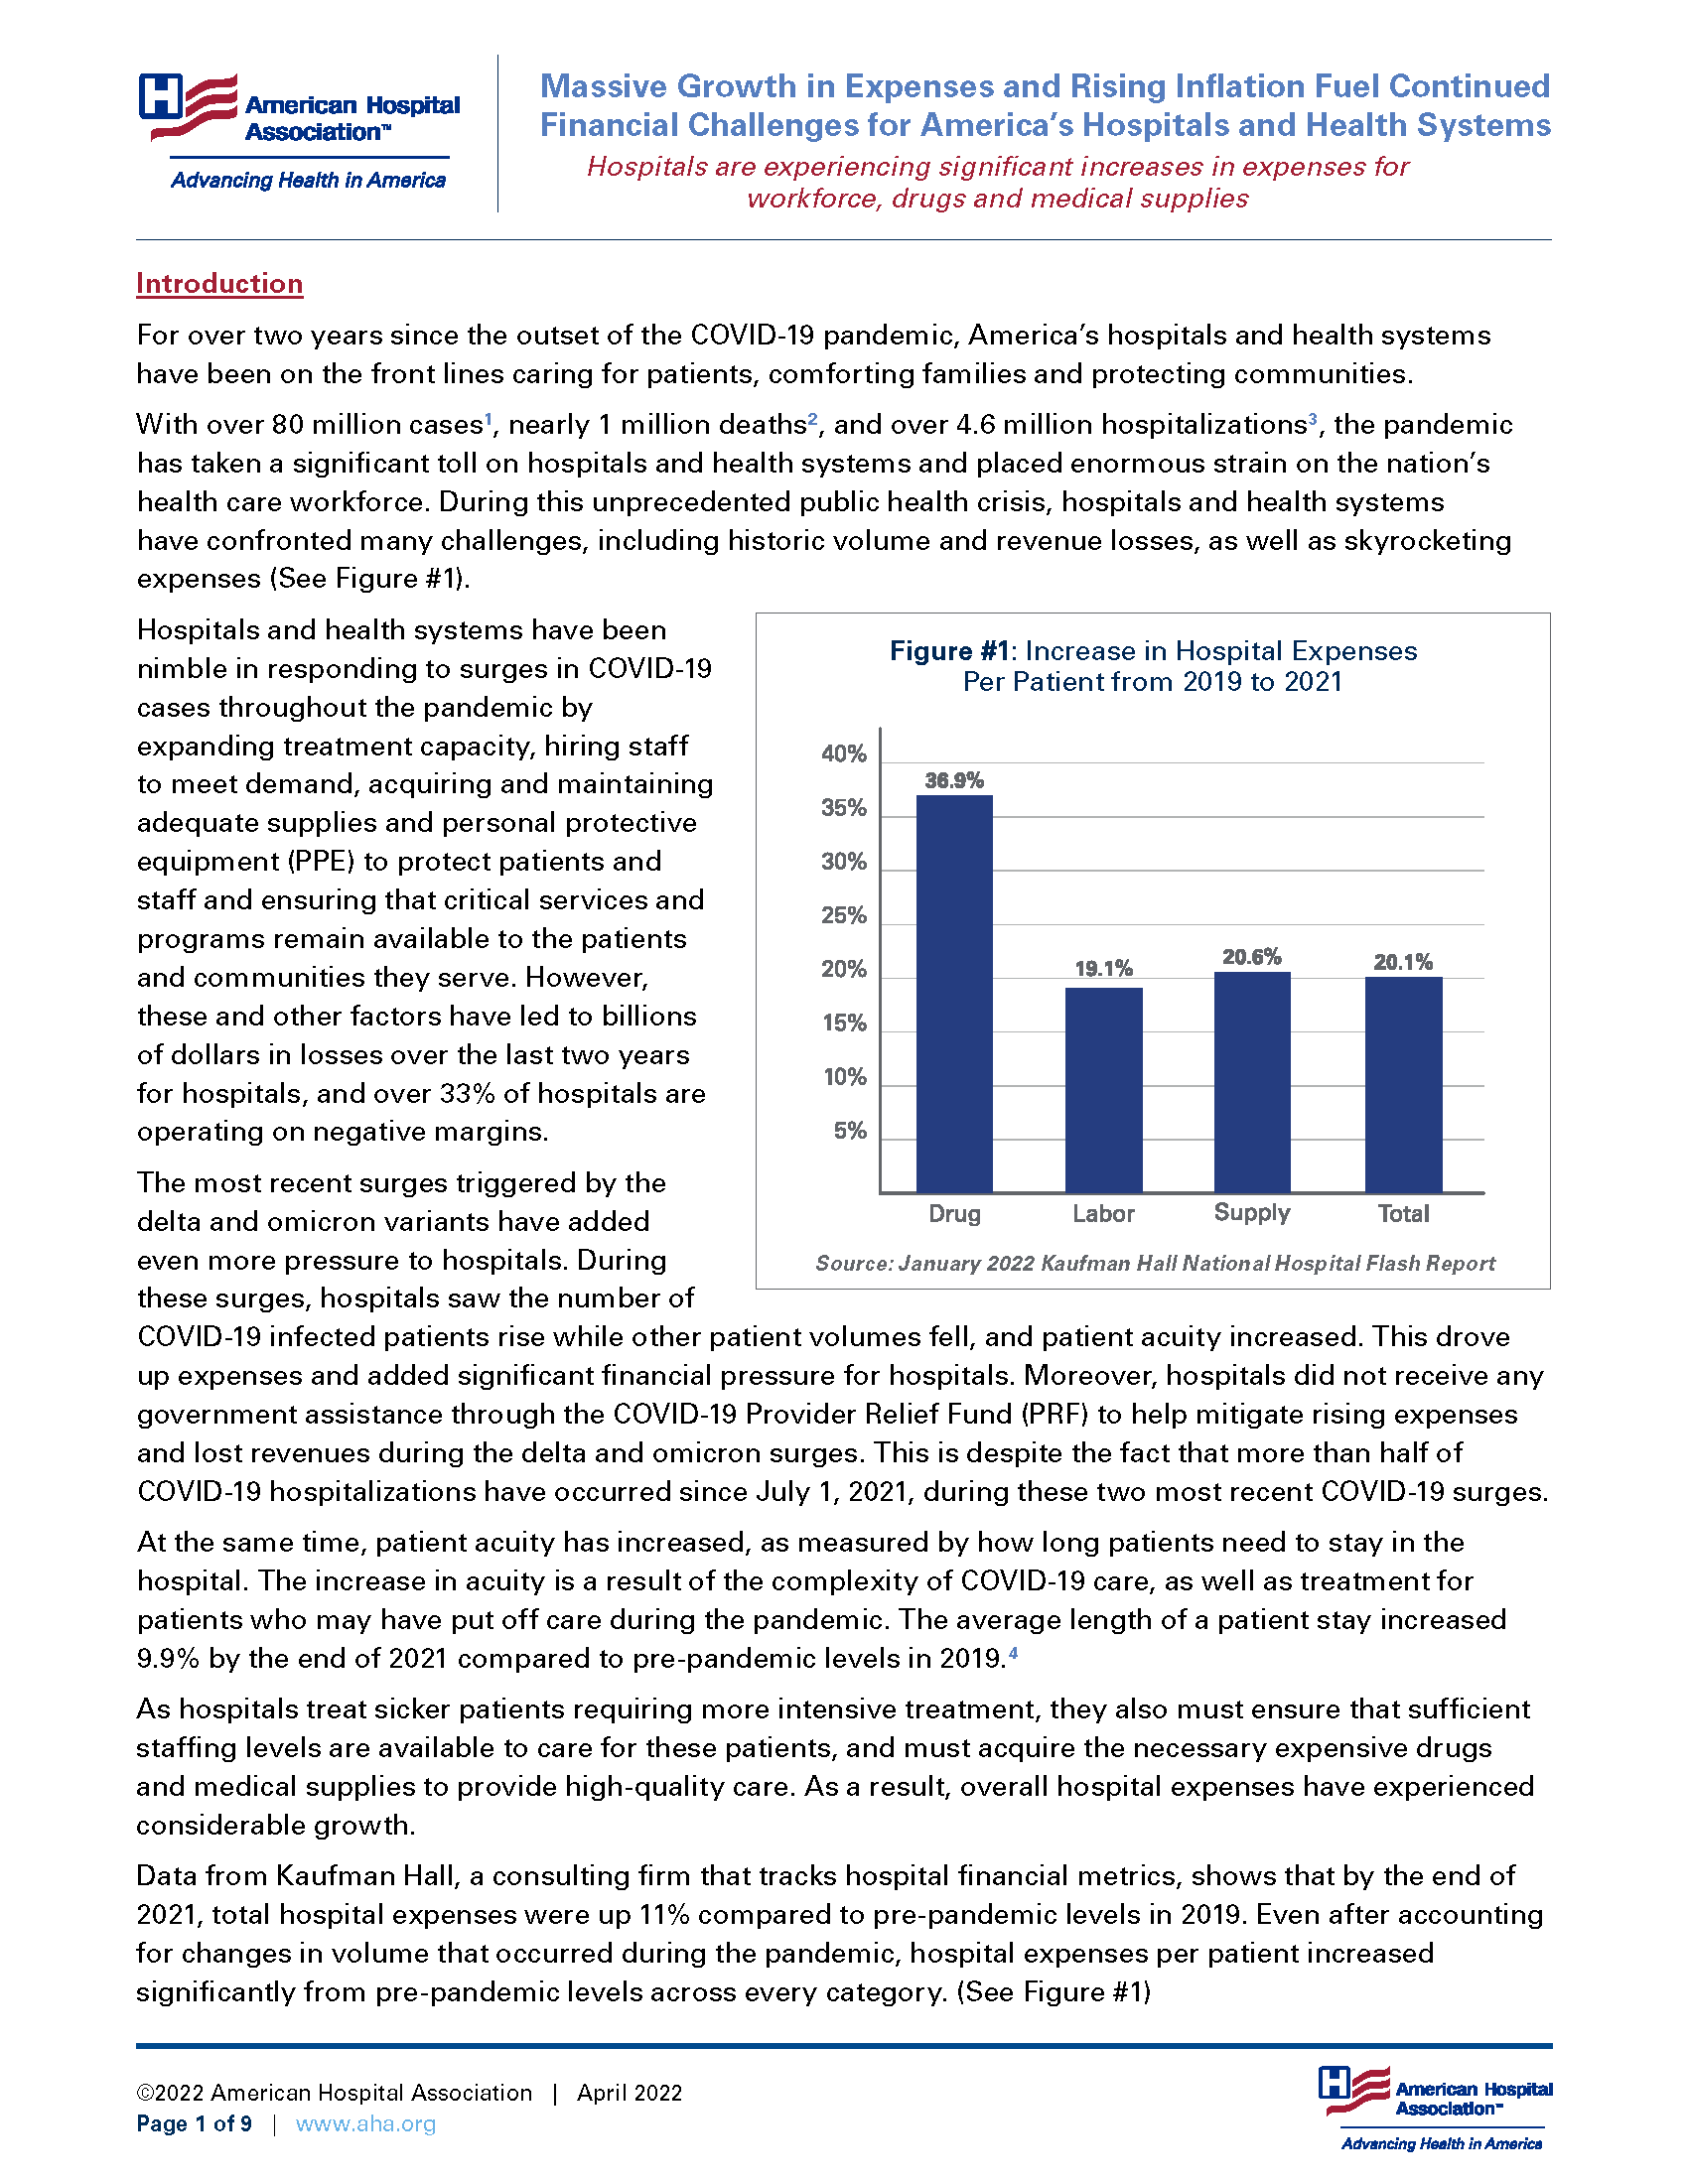
According to a survey by AMN Healthcare, one of the nation’s largest health care staffing agencies, 95% of health care facilities reported hiring nurse staff from contract labor firms during the pandemic.9 Staffing firms have increased their recruitment of contract or travel nurses, illustrating the significant growth in their demand. According to data from EMSI/Burning Glass, there has been a nearly 120% increase in job postings for contract or travel nurses from pre-pandemic levels in January 2019 to January 2022. (See Figure #2)
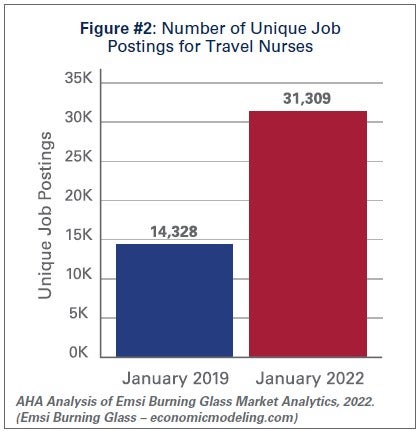
Similarly, the hours worked by contract or travel nurses as a percentage of total hours worked by nurses in hospitals has grown from 3.9% in January 2019 to 23.4% in January 2022, according to data from Syntellis Performance Solutions. (See Figure #3) In fact, a quarter of hospitals have experienced nearly a third of their total nurse hours accounted for by contract or travel nurses.
 As the share of contract travel nurse hours has grown significantly compared to before the pandemic, so too have the costs of employing travel nurses compared to pre-pandemic levels. In 2019, hospitals spent a median of 4.7% of their total nurse labor expenses for contract travel nurses, which skyrocketed to a median of 38.6% in January 2022. (See Figure #3) A quarter of hospitals — those who have had to rely disproportionately on contract travel nurses — saw their costs for contract travel nurses account for over 50% of their total nurse labor expenses. In fact, while contract travel nurses accounted for 23.4% of total nurse hours in January 2022, they accounted for nearly 40% of the labor expenses for nurses. (See Figure #3) This difference has grown considerably compared to pre-pandemic levels in 2019, suggesting that the exorbitant prices charged by staffing companies are a primary driver of higher labor expenses for hospitals.
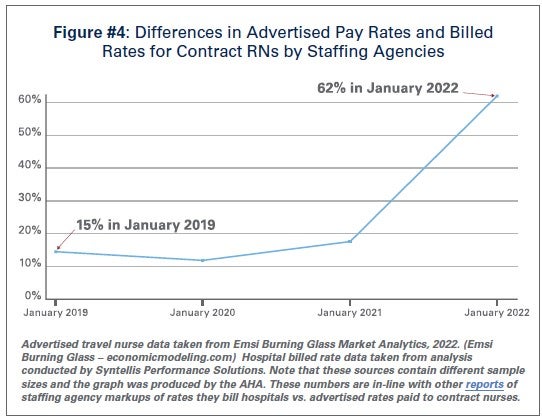
Data from Syntellis Performance Solutions show a 213% increase in hourly rates charged to hospitals by staffing companies for travel nurses in January 2022 compared to pre-pandemic levels in January 2019. This is because staffing agencies have exploited the situation by increasing the hourly rates billed to hospitals for contract travel nurses more than the hourly rates they pay to travel nurses. This is effectively the “margin” retained by the staffing agencies. During pre-pandemic levels in 2019, the average “margin” retained by staffing agencies for travel nurses was about 15%. As of January 2022, the average “margin” has grown to an astounding 62%. (See Figure #4)
 These high “margins” have fueled massive growth in the revenues and profits of health care staffing companies. Several staffing firms have reported significant growth in their revenues to as high as $1.1 billion in just the fourth quarter of 202110, tripling their revenues and net income compared to 2020 levels.11
The data indicate that the growth in labor expenses for hospitals and health systems was in large part due to the exorbitant rates charged by contract staffing firms. By the end of 2021, hospital labor expenses per patient were 19.1% higher than pre-pandemic levels, and increased to 57% at the height of the omicron surge in January 2022.12 A study looking at hospitals in New Jersey found that the increased labor expenses for contract staff amounted to $670 million in 2021 alone, which was more than triple what their hospitals spent in 2020.13 High reliance on contract or travel staff prevents hospitals and health systems from investing those costs into their existing employees, leading to low morale and high turnover, which further exacerbates the challenges hospitals and health systems have been facing.
 Prescription drug spending in the U.S. has grown significantly since the pandemic. In 2021, drug spending (including spending in both retail and non-retail settings) increased 7.7%14, which was on top of an increase of 4.9%15 in 2020. While some of this growth can be attributed to increased utilization as patient acuity increased during the pandemic, a significant driver has been the continued increase in prices of existing drugs as well as the introduction of new products at very high prices. A study by GoodRx found that in January 2022 alone, drug companies increased the price of about 810 brand and generic drugs that they reviewed by an average of 5.1%.16 These price increases followed massive price hikes for certain drugs often used in the hospital such as Hydromorphone (107%), Mitomycin (99%), and Vasopressin (97%).17 For another example, the drug manufacturer of Humira, one of the most popular brand drugs used to treat rheumatoid arthritis, increased the price of the drug by 21% between 2019 and 2021.18 A study by the Kaiser Family Foundation found that in Medicare Part B and D markets, half of all drugs in each market experienced price increases above the rate of inflation between 2019 and 2020 – in fact, a third of these drugs experienced price increases of greater than 7.5%.19 At the same time, according to a report by the Institute for Clinical and Economic Review (ICER), eight drugs with unsupported U.S. drug price increases between 2019 and 2020 alone accounted for an additional $1.67 billion in drug spending, further illustrating that drug companies’ decisions to raise the prices of their drugs are simply an unsustainable practice.20
As hospitals have worked to treat sicker patients during the pandemic, they have been forced to contend with sky-high prices for drugs, many of which are critical and lifesaving for their patients. For example, in 2020, 16 of the top 25 drugs by spending in Medicare Part B (hospital outpatient settings) had price increases greater than inflation — two of the top three drugs, Keytruda and Prolia — experienced price increases of 3.3% and 4.1%, respectively.21
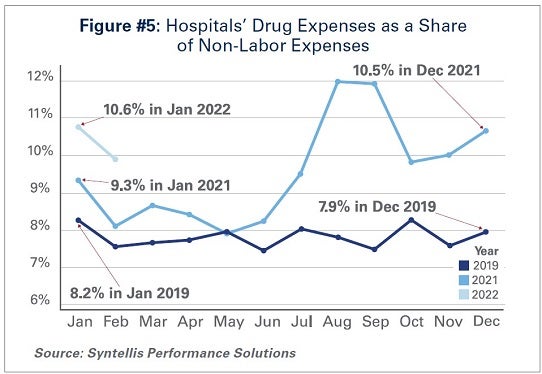
As a result of these price increases, hospital drug expenses have skyrocketed. By the end of 2021, total drug expenses were 28.2% higher than pre-pandemic levels.22 When taken as a share of all non-labor expenses, drug expenses have grown from approximately 8.2% in January 2019, to 9.3% in January 2021, and to 10.6% in January 2022. (See Figure #5) Even when considering changes in volume during the pandemic, drug expenses per patient compared to pre-pandemic levels in 2019 saw significant increases, with a 36.9% increase through 2021.
While continued drug price increases by drug companies have been a major driver of the growth in overall hospital drug expenses, there also are other important driving factors to consider:
Taken together, these factors increase both drug expenses and overall hospital expenses.
The U.S., like most countries in the world, relies on global supply chains for goods and services. This is especially true for medical supplies used at hospitals and other health care settings. Everything from the masks and gloves worn by staff to medical devices used in patient care come from a large network of global suppliers. Prior to the global pandemic, hospitals had established relationships with distributors and other vendors in the global health care supply chain to deliver goods as necessitated by demand. After the pandemic hit, many factories, distributors and other vendors shut down their operations, leaving hospitals, which were on the front lines facing surging demand, to fend for themselves. In fact, supply chain disruptions across industries, including health care, increased by 67% in 2020 alone.26
As a result, hospitals turned to local suppliers and non-traditional suppliers, often paying significantly higher rates than they did prior to the pandemic. Between fall 2020 and early 2022 costs for energy, resins, cotton and most metals surged in excess of 30%; these all are critical elements in the manufacturing of medical supplies and devices used every day in hospitals.27 As COVID-19 cases surged, demand for hospital PPE, such as N95 masks, gloves, eye protection and surgical gowns, increased dramatically causing hospitals to invest in acquiring and maintaining reserves of these supplies. Further, downstream effects from other global events such as the war in Ukraine and the energy crisis in China, as well as domestic issues, such as labor shortages and rising fuel and transportation costs, have all contributed to drive up even higher overall medical supply expenses for hospitals in the U.S.28 For instance, according to the Health Industry Distributors Association, transportation times for medical supplies are 440% longer than pre-pandemic times resulting in massive delays.29
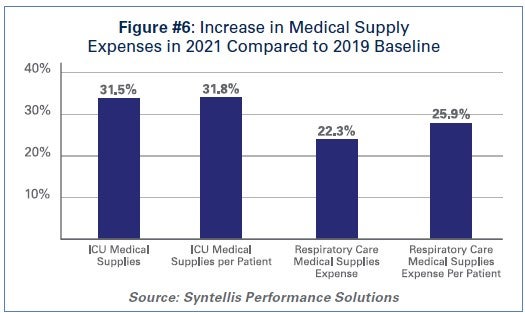 Compared to 2019 levels, supply expenses for hospitals were up 15.9%30 through the end of 2021. When focusing on hospital departments involved most directly in care for COVID-19 patients − primarily hospital intensive care units (ICUs) and respiratory care departments − the increase in expenses is significantly higher. Medical supply expenses in ICUs and respiratory care departments increased 31.5% and 22.3%, respectively. Further, accounting for changes in volume during surge and non-surge periods of the pandemic, medical supply expenses per patient in ICUs and respiratory care departments were 31.8% and 25.9% higher, respectively. (See Figure #6) These numbers help illustrate the magnitude of the impact that increases in supply costs have had on hospital finances during the pandemic.
Higher economy-wide costs have serious implications for hospitals and health systems, increasing the pressures of higher labor, supply, and acquisition costs; and potentially lower consumer demand. Inflation is defined as the general increase in prices and the decrease in purchasing power. It is measured by the Consumer Price Index (CPI-U). In April 2021, the Bureau of Labor Statistics (BLS) reported that the CPI-U had the largest 12-month increase since September 2008. The CPI-U hit 40-year highs in February 2022.31 Overall, consumer prices rose by a historic 8.5% on an annualized basis in March 2022 alone.32
As inflation measured by consumer prices is at record highs, below are key considerations on the potential impact of higher general inflation on hospital prices:
 Health care and hospital prices are not driving recent overall inflation increases. The BLS has cited increases in the indices for gasoline, shelter and food as the largest contributors to the seasonally adjusted all items increase. The CPI-U increased 0.8% in February on a seasonally adjusted basis, whereas the medical care index rose 0.2% in February. The index for prescription drugs rose 0.3%, but the hospital index for hospital services declined 0.1%.33
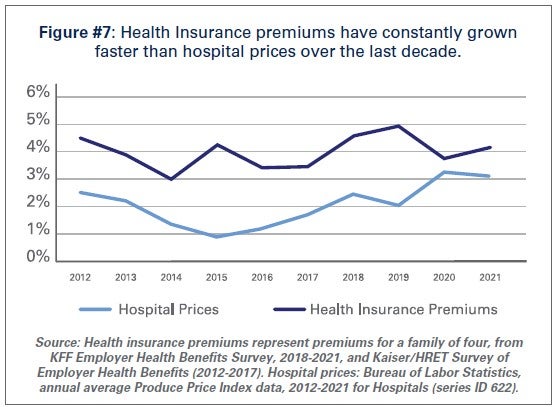
This is consistent with pre-pandemic trends. Despite persistent cost pressures, hospital prices have seen consistently modest growth in recent years. According to BLS data, hospital prices have grown an average 2.1% per year over the last decade, about half the average annual increase in health insurance premiums. (See Figure #7) More recently, hospital prices have grown much more slowly than the overall rate of inflation. In the 12 months ending in February 2022, hospital prices increased 2.1%. In fact, even when excluding the artificially low rates paid to hospitals by Medicare and Medicaid, average annual price growth has still been below 3% in recent years.34
While we hope that our nation is rounding the corner in the battle against COVID-19, it is clear that the pandemic is not over. During the week of April 11, there have been an average of over 33,000 cases per day35 and reports suggest that a new subvariant of the virus (Omicron BA.2) is now the dominant strain in the U.S.36 As a result, the challenges hospitals and health systems are currently facing are bound to last much longer.
As COVID-19 infections and hospitalizations are decreasing in some parts of the U.S. and increasing in others, hospitals and health systems continue to care for COVID-19 and non-COVID-19 patients. With additional surges potentially on the horizon, the massive growth in expenses is unsustainable. Most of the nation’s hospitals were operating on razor thin margins prior to the pandemic; and now, many of these hospitals are in an even more precarious financial situation. Regardless of potential new surges of COVID-19, hospitals and health systems continue to face workforce retention and recruitment challenges, supply chain disruptions and exorbitant expenses as outlined in this report.
Hospitals appreciate the support and resources that Congress has provided throughout the pandemic; however, additional support is needed now to keep hospitals strong so they can continue to provide care to patients and communities.