

Letter/Comment
Fact Sheet: Hospital Costs Explained
Updated May 25, 2021
The mission of each and every hospital in America is to serve the health care needs of the people in its community 24 hours a day, seven days a week. But, hospitals’ work is made more difficult by our fragmented health care system — a system that leaves millions of people unable to afford the health care services they need.
Hospitals deal with over 1,000 insurers,1 which typically have several different plan options. For instance, in the Federally-Facilitated Exchange (FFE) program specifically, there are approximately 120 unique insurers offering over 75,000 discrete health plan options2 leading to multiple and often unique requirements for hospital bills. Add to that decades of government regulations, which have made a complex billing system even more complex and frustrating for everyone involved.
Over the past year, the COVID-19 pandemic has placed a tremendous strain on hospitals and health systems across the country. In 2020 alone, the AHA estimated that hospital financial losses were at least $323.1 billion.3 As the pandemic has continued to persist well into 2021, a recent report by Kaufman Hall forecasts that hospitals and health systems could face an additional $53 billion to $122 billion in losses in 2021.4 Today’s fragmented health care system, exacerbated by the COVID-19 pandemic, leaves hospitals with a daily balancing act to maintain their mission to the communities they serve while making ends meet. The following is an explanation of key components of hospital billing, including hospital charges, payment and costs.
Charges vs. Payments
 Federal laws and regulations require hospitals to maintain uniform charge structures. Payments, however, do not correspond to those charges. What a hospital actually receives in payment for care is very different. That is because:
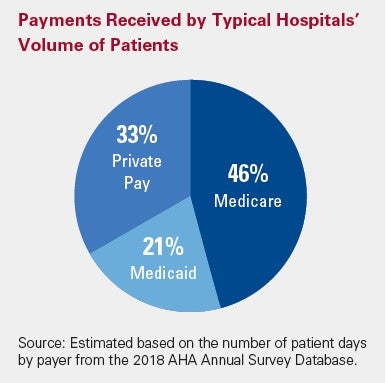
- Medicare: 46% of the typical hospital’s volume5
- Medicaid: 21% of the typical hospital’s volume6
- Private pay patients make up 33% of the typical hospital’s volume7
- For fee-for-service Medicare patients, the U.S. Congress sets hospital payment rates.
- For fee-for-service Medicaid patients, state governments set hospital payment rates.
- Private insurance companies negotiate payment rates with hospitals. Private insurance company payment rates vary widely with larger insurance companies typically better positioned to demand bigger discounts.
- Tax-exempt hospitals are prohibited from billing gross charges for those eligible for financial assistance. Under the ACA, tax-exempt hospitals are required to have a written financial assistance policy that is widely distributed in the community. Care is either provided for free, or based wholly or partly on Medicare rates under the Internal Revenue Service (IRS) regulations.
- Insured patients who are seeking care at a hospital outside their insurance company’s network, patients ineligible for financial assistance and patients whose care is paid for by other types of insurance (e.g., worker’s compensation, auto liability insurance, etc.), are the only patients that may be billed full charges.
Payments vs. Costs
It is important to note that negotiated payments from insurers and public programs do not always reflect the actual cost of providing care. Medicare and Medicaid pay less than cost, the uninsured pay little or nothing, and others must make up the difference.
- Medicare and Medicaid pay less than the cost of caring for program beneficiaries – a shortfall of $75.8 billion in 2019 borne by hospitals.8
- Hospitals provided $41.6 billion in uncompensated care, both free care and care for which no payment is made by patients, in 2019.9
- Private insurance and others often make up the difference.
Payments relative to costs vary greatly among hospitals depending on the mix of payers.
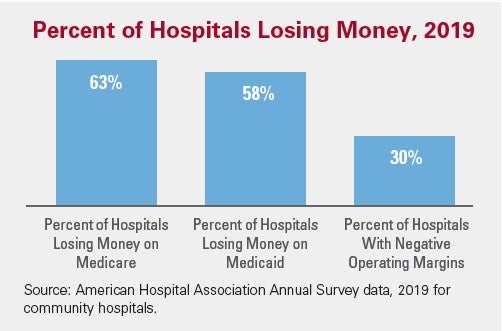
Percent of Hospitals Losing Money, 2019
In 2019, approximately 63 percent of hospitals lost money providing care to Medicare and 58 percent lost money providing care to Medicaid patients and about 30 percent of hospitals were operating on negative operating margins (see chart).
 America’s hospitals are faced with mounting financial challenges. Government programs like Medicare and Medicaid pay hospitals less than the cost of caring for the beneficiaries these programs cover while insurance companies negotiate deep discounts with hospitals. The growing numbers of uninsured and underinsured further complicate this financial picture. While there are government programs such as Medicare and Medicaid disproportionate hospital payments designed to help hospitals with the cost of treating low-income and uninsured patients, it is not enough to cover the cost of care.
These inequities in payment leave hospitals with a challenging balancing act. Hospitals must ensure that the payments they receive for care from all sources exceed the costs of providing that care. A hospital cannot continue to lose money year after year and remain open. Hospitals need a positive bottom line in order to be able to keep up with new technologies and treatments, replace or improve old buildings, and otherwise invest in maintaining and improving their services to meet the rising demand for care. It also helps ensure they can attract and retain frontline caregivers and other critical staff and purchase personal protective equipment (PPE), drugs and other necessary supplies.
Sources
- https://content.naic.org/sites/default/files/inline-files/2019%20Health%20Industry%20Commentary_0.pdf.
- The data are from issuer submissions of their QHP applications, and were pulled from the Health Insurance Oversight System (HIOS) for Federallyfacilitated states and the System for Electronic and Rate Form Filling (SERFF) for State Partnership states and State-Based Exchange states that use HealthCare.gov. The data are current as of April 28, 2021, and are subject to change.
- https://www.aha.org/system/files/media/file/2020/06/aha-covid19-financial-impact-report.pdf.
- https://www.aha.org/system/files/media/file/2021/03/Kaufman-Hall-2021-Margins-Report-final.pdf.
- Estimated based on the number of patient days by payer from the 2019 AHA Annual Survey Database.
- Ibid.
- Ibid.
- Taken from the 2019 AHA Annual Survey Database
- Ibid.
Key Resources
Related Resources
Advisory
Fact Sheets