


Guides/Reports
American Hospital Association
Lane Koenig, PhD
Julia Sheriff
Ori Nevo, MPH
Mehmet Sari, PhD
KNG Health Consulting, North Bethesda, MD, USA
Medicare beneficiaries may receive ambulatory care services in different settings, including independent physician offices (IPOs), hospital outpatient departments (HOPDs), emergency departments (EDs), and – for surgical services – ambulatory surgical centers (ASCs). While there is overlap in the types of services provided, the cost of care varies across settings. Treatment costs can differ across settings due to variation in both regulatory requirements and patient needs, as a result of differences in clinical factors and social determinants of health (SDOH).
In this study, we compared Medicare beneficiary characteristics between those treated in different ambulatory settings between 2019 and 2021 to better understand how patient needs vary. We constructed two primary cohorts and conducted analyses on a subset of patients with cancer. First, we compared beneficiaries treated in hospital outpatient settings (including EDs) to beneficiaries treated in IPOs. We completed a similar comparison for a subset of patients with a cancer diagnosis. Second, we compared beneficiaries who received outpatient surgery in HOPDs to those who primarily received outpatient surgery in ASCs. Our findings suggest higher needs for patients treated in HOPDs as compared to other settings, because of SDOH and higher clinical complexity.
We conducted the analyses using claims data for a 5% sample of beneficiaries in traditional Medicare (i.e., Fee-for-Service) that used either HOPD, IPO, or ASC services in 2019, 2020, or 2021. The sample was limited to beneficiaries who had at least one claim from an HOPD or IPO (HOPD/IPO cohort), or ASC (HOPD/ASC cohort). In addition, we limited the HOPD/ASC analyses to claims that included services paid under the Medicare ASC fee schedule. For those assigned to the HOPD/IPO cohort, we conducted a sub-analysis on patients with a principal diagnosis of cancer on an HOPD or IPO claim. (See Appendix for additional details on methods.)
For each cohort (HOPD/IPO and HOPD/ASC), patients were assigned to the setting where they received the majority of their ambulatory care in a year.1
We compared beneficiary socioeconomic and clinical characteristics. Socioeconomic characteristics included Medicare-Medicaid dual enrollment (dual eligible) and race/ethnicity. Clinical characteristics included original reason for Medicare entitlement and two medical condition measures: (1) percent with a comorbidity or complication (CC) or major CC (MCC) as defined by the Centers for Medicare & Medicaid Services; and (2) Charlson Comorbidity Index (CCI).
For dichotomous variables, we report the percentage of beneficiaries with an attribute (e.g., dual eligible) and “relative risk,” calculated as the HOPD percentage divided by the IPO (or ASC) percentage. This measure represents the relative likelihood of an HOPD beneficiary having a characteristic as compared to an IPO (or ASC) beneficiary.2 All statistics referenced in this report refer to averages of annual statistics across years 2019-2021. All annual differences in values were tested using t-tests and found to be statistically significant at the .001 level.
We identified, on average, approximately 249,000 HOPD beneficiaries with 3 million claims, and 1.1 million IPO beneficiaries with 18.1 million IPO claims annually over the study period, in the 5% sample.
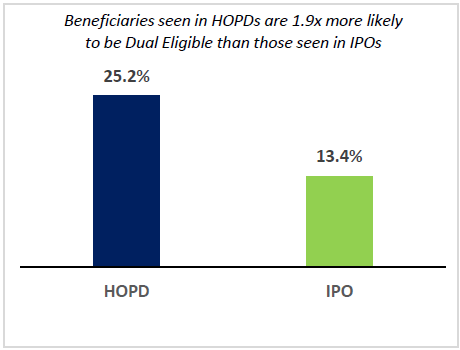
As compared to IPO beneficiaries, HOPD beneficiaries were more likely to be non-White (1.5 and 1.4 times more likely to be Black and Hispanic, respectively) and enrolled in Medicaid (Figure 1: 1.9 times more likely to be dual eligible).
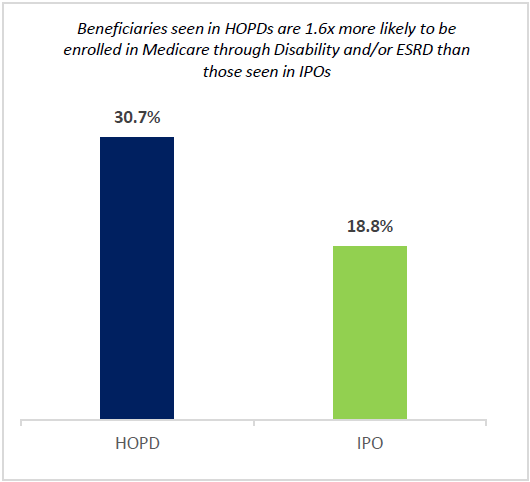
HOPD beneficiaries were more likely to enter into the Medicare program due to disability or end-stage renal disease (ESRD) (Figure 2), which accounts for the greater share of under 65-year-old beneficiaries in HOPDs. Across the study period, 31% of HOPD beneficiaries were originally enrolled in Medicare due to disability and/or ESRD as compared to 19% for IPO (1.6 times more likely for HOPD than IPO).
Source: KNG Health Consulting, LLC analysis of 2018 -2021 Medicare Inpatient, Outpatient, and Carrier Standard Analytic Files
Note: HOPD = Hospital Outpatient Department; IPO = Independent Physician Office
Source: KNG Health Consulting, LLC analysis of 2018 -2021 Medicare Inpatient, Outpatient, and Carrier Standard Analytic Files
Note: HOPD = Hospital Outpatient Department; IPO = Independent Physician Office; ESRD = End Stage Renal Disease
Source: KNG Health Consulting, LLC analysis of 2018 -2021 Medicare Inpatient, Outpatient, and Carrier Standard Analytic Files
Note: HOPD = Hospital Outpatient Department; IPO = Independent Physician Office; CC = Comorbidities and Complications; MCC= Major CC
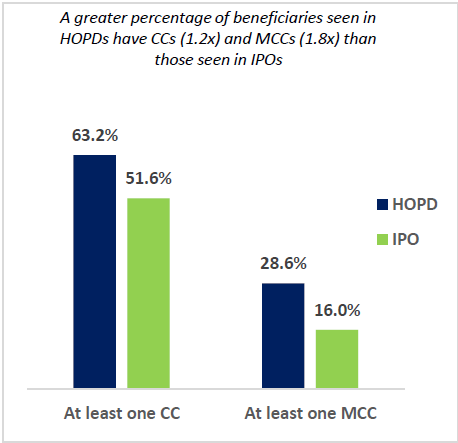
HOPD beneficiaries had higher clinical complexity than IPO beneficiaries across all measures examined:
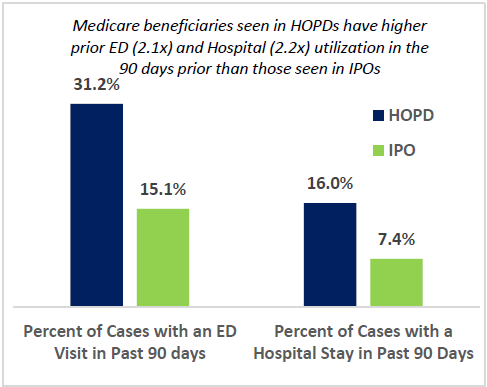
When examining prior utilization of healthcare services as a proxy for clinical complexity, our results align with other findings. On a per claim basis, HOPD beneficiaries were more than twice as likely as IPO beneficiaries to have had an ED visit or inpatient hospital stay in the prior 90 days (Figure 4).
Medicare beneficiaries with cancer were roughly four times more likely to seek ambulatory care in an HOPD as compared to an IPO. We conducted a sub analysis for beneficiaries with cancer to assess whether similar patterns to the full HOPD/IPO cohort exist in this group. We found that:
Our findings on other demographic factors, and clinical and prior utilization factors were similar to findings for the overall HOPD IPO cohort.
Source: KNG Health Consulting, LLC analysis of 2018 -2021 Medicare Inpatient, Outpatient, and Carrier Standard Analytic Files
Note: HOPD = Hospital Outpatient Department; IPO = Independent Physician Office; ED = Emergency Department
We identified, on average, approximately 263,000 HOPD beneficiaries with 511,000 claims, and 127,000 ASC beneficiaries with 203,000 ASC claims annually over the study period, in our 5% sample.
Source: KNG Health Consulting, LLC analysis of 2018 -2021 Medicare Inpatient, Outpatient, and Carrier Standard Analytic Files
Note: HOPD = Hospital Outpatient Department; ASC = Ambulatory Surgery Center
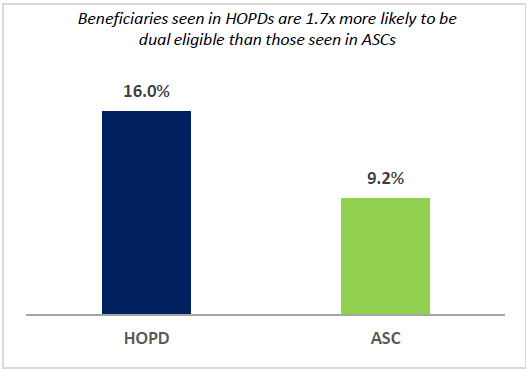
As compared to ASC beneficiaries, HOPD beneficiaries had a similar race/ethnicity composition. However, HOPD beneficiaries were significantly more likely to be enrolled in Medicaid than ASC beneficiaries (Figure 5: 1.7 times more likely to be dual eligible).
The patterns in original reason for Medicare enrollment between HOPD and ASC patients were similar to those between HOPD and IPO patients. Across the study period, 24% of HOPD beneficiaries were originally enrolled in Medicare due to disability and/or ESRD as compared to 16% for ASC beneficiaries (1.6 times more likely for HOPD than ASC beneficiaries). HOPD beneficiaries were more than twice as likely as ASC beneficiaries to be enrolled due to ESRD.
Source: KNG Health Consulting, LLC analysis of 2018 -2021 Medicare Inpatient, Outpatient, and Carrier Standard Analytic Files
Note: HOPD = Hospital Outpatient Department; ASC = Ambulatory Surgery Center; CC = Comorbidities and Complications; MCC= Major CC
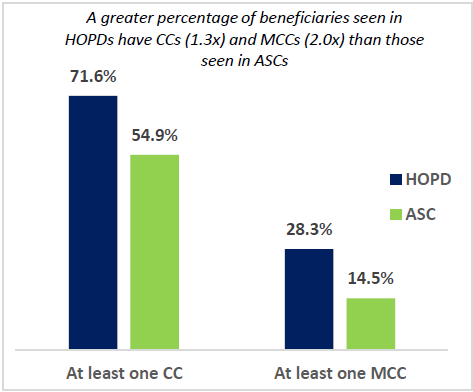
As in the HOPD/IPO cohort, HOPD beneficiaries had higher clinical complexity than ASC beneficiaries across all measures examined:
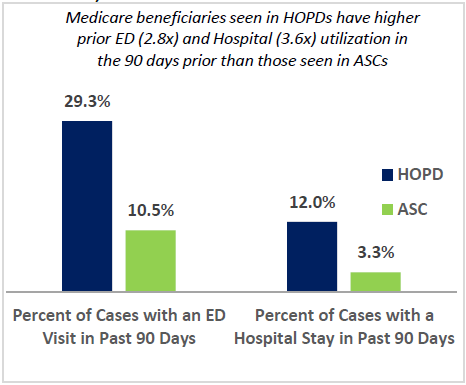
When examining prior utilization in the 90 days prior to HOPD or ASC surgical care, HOPD patients showed higher results than ASC patients across all metrics (Figure 7):
Source: KNG Health Consulting, LLC analysis of 2018 -2021 Medicare Inpatient, Outpatient, and Carrier Standard Analytic Files
Note: HOPD = Hospital Outpatient Department; ASC = Ambulatory Surgery Center; ED = Emergency Department
During the 2019 to 2021 period, we found that Medicare beneficiaries who received care in HOPDs had higher needs than beneficiaries treated in IPOs and ASCs. HOPD beneficiaries were of lower socioeconomic status and were more likely to be non-White compared to ASCs and IPOs. In addition, the percent of beneficiaries enrolled in Medicare due to ESRD and/or disability was higher for HOPD patients. Finally, HOPD patients were more likely to have at least one complication or comorbidity, and more likely to have had a prior hospital stay and ED visit within the past 90 days compared to ASC and IPO patients.
There are limitations that are important to note in this study. First, the study did not include Medicare beneficiaries enrolled in Medicare Advantage. Second, the study period of 2019-2021 encompasses the COVID-19 pandemic, which may have skewed patient and clinical characteristics. Finally, we aligned beneficiaries to the setting where they had the majority of ambulatory care claims. Using an alternative classification method for patients could potentially yield different results.
While there is overlap in the types of services provided across settings, our findings indicate that beneficiary needs, and – as a result – treatment costs may differ across settings due to variation in clinical factors and social determinants of health. Our findings suggest greater capabilities of hospital-based settings as well as disparities in health care access by different beneficiaries. Such factors should be considered by policymakers when assessing changes to Medicare policies.
To complete the study, KNG Health analyzed data from the following files:
We used the 2018-2021 SAFs to identify Medicare beneficiary HOPD and IPO claims and prior use of ED and hospital services (2018 data was used to obtain 90-day prior utilization for 2019 data cohort); and the 2018-2021 Denominator files to identify beneficiaries with continuous enrollment in Medicare during the year and 3 months prior (to ensure prior utilization data would be available on claims) and other demographic information. We used 2015 and 2019 data from the 2020-2021 Area Health Resources File, sourced from the 2019 1-year and the 2019 5-year American Community Survey to describe median income.
We conducted analyses on three Medicare fee-for-service cohorts:
All beneficiaries included in the study had continuous enrollment in Medicare FFS Part A and Part B in all months alive during the respective calendar year, and the last three months of the prior calendar year. HOPD-IPO cohorts included patients who had at least 1 HOPD or IPO visit during the calendar year, and the HOPD-ASC cohort included patients who had at least 1 HOPD or ASC claim for an ASC-covered surgical procedure during the calendar year. The HOPD-IPO cancer patients were identified based on principal diagnoses across their HOPD and IPO claims. Cancer conditions were defined by AHRQ’s Clinical Classification Software (CCS) (CCS 11-45).
To determine patient assignments into the HOPD-IPO cohort or the HOPD-ASC cohort, we compared the number of claims in each pair of settings. Beneficiaries were included in the study and assigned to a setting if they received over 50% of their care in that setting. To examine annual differences in patient and visit characteristics between HOPDs and IPOs or HOPDs and ASCs, we assessed differences in average characteristics between the two settings using t-tests.
| Setting | Identification |
|---|---|
| HOPD |
|
| IPO | Carrier claims with place of service code of “11=Office” |
| ASC-HOPD |
|
| ASC |
|