

Exploring Metropolitan Anchor Hospitals and the Communities They Serve
Final Report
Date: October 2022
Presented to: The American Hospital Association
Presented by: NORC at the University of Chicago; Alex Hartzman, Mairin Mancino, Lia Martinez, Claudia Gorman
Contents
Exploring the “Metropolitan Anchor Hospital” Designation
Executive Summary
The American Hospital Association (AHA) identified and defined a particular set of urban safety net hospitals — the Metropolitan Anchor Hospital (MAH) — that serve large numbers of urban, low-income and historically marginalized individuals. This report describes the distinguishing attributes of these hospitals and the communities they serve.
AHA contracted with NORC at the University of Chicago (NORC) to conduct qualitative and quantitative research describing safety net hospitals in the U.S., in general, and, more specifically, the characteristics of the hospitals the AHA has identified as MAHs. In this paper, we review the available literature involving U.S. safety net hospitals, discuss the background of AHA’s proposed definition and examine the underlying data used to develop the definition, and present various descriptive characteristics of MAHs and the communities they serve. There are 465 MAH-designated hospitals across 162 metropolitan statistical areas (MSAs). When we compare MAH hospitals to other hospitals, we use the non-MAH hospitals in these 162 urban markets as the comparison group (referred to as “comparison hospitals” throughout this paper). All quantitative analyses conducted by NORC use pre-pandemic data.
MAHs provide a disproportionately high amount of Medicaid and uncompensated care within their markets.
In general, MAHs:
- Are larger hospitals
- Are more likely to provide essential services
- Provide a greater number of these essential services, such as burn care, neonatal intensive care, inpatient psychiatric care, substance use disorder services, HIV care
- Are major teaching hospitals
- Are larger employers in their catchment areas than comparison hospitals
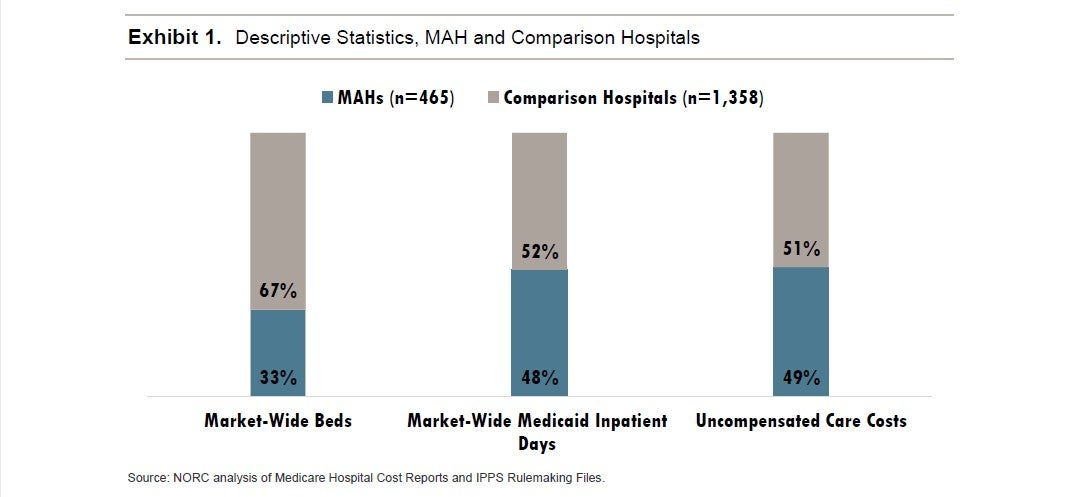
Our analysis finds that MAHs provide an outsized portion of uncompensated care and Medicaid care within their urban market areas (Exhibit 1). MAHs are typically larger, accounting for 33% of market-wide beds and an estimated 34% of market-wide inpatient revenue. MAHs also provide a disproportionately high amount of care to historically marginalized populations, accounting for about 48% of market-wide Medicaid inpatient days and 49% of market-wide uncompensated care costs. Overall, the average Medicaid Inpatient Utilization Rate (MIUR) of a MAH is nearly 37%, compared to 17% in other hospitals in those same 162 markets. This means that MAHs are more likely to occupy inpatient beds with Medicaid beneficiaries than the other metropolitan hospitals serving the same area.
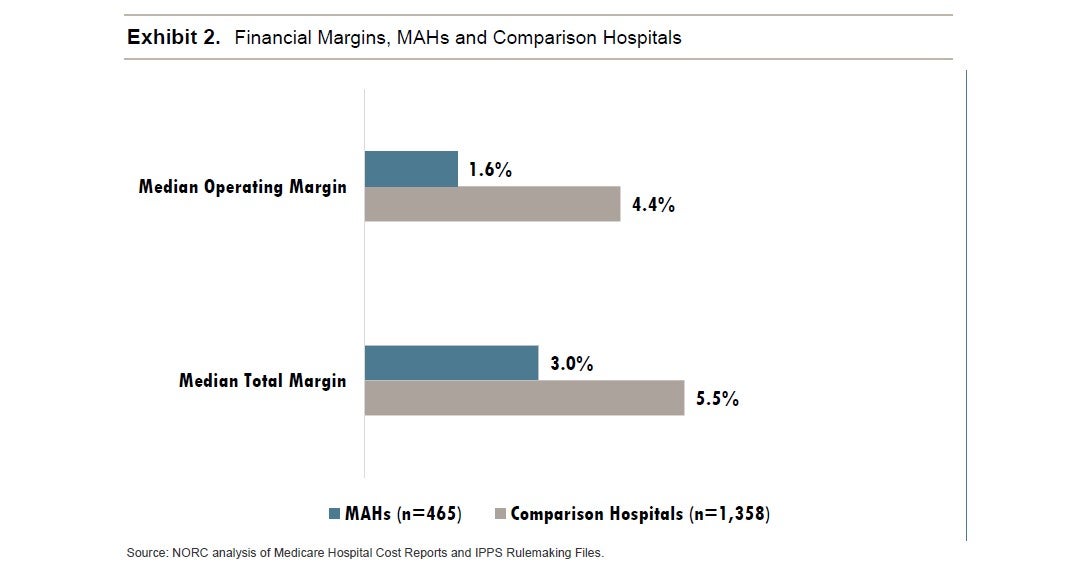
MAHs experience higher net patient revenues but lower total margins and lower operating margins than other hospitals in their markets (Exhibit 2).
Introduction
During the last two years, the COVID-19 pandemic has stretched the capacity and tested the strength of the U.S. health care delivery system, with hospitals across the country operating at full or beyond capacity during prolonged COVID-19-surge periods.i Hospitals and health systems are not built to operate at or beyond bed or staffing capacity for extended periods of time. The pandemic has placed great strain on all hospitals, including hospitals that play a safety net role. Government relief funding provided to hospitals during the pandemic helped to offset the financial losses they experienced,ii however pandemic surges continue to put financial pressures on hospitals.iii As the pandemic stabilizes and puts less acute, short-term financial pressure on hospitals, there is an opportunity to take the learnings from the pandemic to revisit many aspects of how the U.S. pays providers for health care services, including hospital care at safety net hospitals. This paper is designed to contribute to that discussion by exploring a particular safety net designation recently developed by the AHA: the Metropolitan Anchor Hospital (MAH).
America’s safety net hospitals provide a substantial amount of care to low income, uninsured and historically marginalized populations.
America’s hospitals have a long history of providing care to low-income and marginalized members of their communities, with many of the earliest hospitals specifically founded and operated by religious or charitable organizations to provide care and comfort to the poor and afflicted. Today, many of America’s hospitals are considered safety net hospitals, a term that lacks a formal definition, but is generally used to describe hospitals that serve a large percentage of Medicaid and uninsured patients, many of whom are part of historically marginalized communities. Safety net hospitals can serve urban and rural geographies. The MAH, by definition, is specifically limited to urban hospitals and as such this discussion eschews issues of the impact of non-urban safety net providers.
There is widespread agreement that many hospitals provide a substantial amount of care to large numbers of low-income and historically marginalized populations and that such hospitals face special challenges meriting policy focus. However, there is no single definition of a “safety net hospital.” In a groundbreaking analysis of the nation’s health care safety net, the Institute of Medicine (IOM, now the National Academy of Medicine) noted “a general lack of agreement and ongoing debate on which providers constitute the health care safety net.”iv In the absence of a universally accepted, single definition, IOM defined safety net providers as “providers that organize and deliver a significant level of health care and other health-related services to uninsured, Medicaid, and other vulnerable patients.”v While widely cited, the IOM definition left several open questions, including how to define “significant” and which patients should be considered “vulnerable.” A 2021 systemic review of health services researchers’ definitions of what constitutes a safety net hospital found 11 separate definitions used in recent studies, based on five separate categories including facility characteristics (e.g., status as a public or teaching hospital), patient case-mix (e.g., socioeconomic and/or health status) Medicaid Disproportionate Share Hospital (DSH) payment status, Medicaid caseload and/or level of uncompensated care.vi
Together, between 25% and 35% of the U.S. population either lacks insurance or relies on Medicaid (the federal-state program focused on providing care to low-income individuals, families and children as well as the disabled and elderly), and more than half of these individuals are part of historically marginalized groups. During the pandemic, Medicaid enrollment increased from 70.7 million in February 2020 to 83.2 million by June 2021,vii and in 2020, an estimated 31.6 million additional Americans lacked health insurance.viii Historically marginalized populations are disproportionately uninsured or Medicaid beneficiaries and face health inequities, immense structural barriers, and need timely, culturally competent care. They often rely on safety net hospitals for their health care, ranging from primary care to highly specialized inpatient and outpatient services.
Notes
- Bloomberg https://www.bloomberg.com/graphics/2021-covid-surge-shows-overwhelming-cost-of-being-unvaccinated-america/
- Kaufman Hall https://www.kaufmanhall.com/insights/article/national-hospital-flash-report-summary-june-2020
- Kaufman Hall https://www.kaufmanhall.com/insights/research-report/national-hospital-flash-report-april-2022
- IOM https://www.nap.edu/download/9612
- IOM https://www.nap.edu/download/9612
- Hefner, J.L., Hogan, T.H., Opoku-Agyeman, W. et al. Defining safety net hospitals in the health services research literature: a systematic review and critical appraisal. BMC Health Serv Res 21, 278 (2021). https://doi.org/10.1186/s12913-021-06292-9
- Centers for Medicare and Medicaid Services. “June 2021 Medicaid and CHIP Enrollment Trends Snapshot.” 2021. https://www.medicaid.gov/medicaid/national-medicaid-chip-program-information/downloads/june-2021-medicaid-chip-enrollment-trend-snapshot.pdf
- Cohen RA, Terlizzi EP, Cha AE, Martinez ME. “Health insurance coverage: Early release of estimates from the National Health Interview Survey.” 2020. Centers for Disease Control and Prevention National Center for Health Statistics. August 2021. https://www.cdc.gov/nchs/data/nhis/earlyrelease/insur202108-508.pdf

Metropolitan Anchor Hospital Case Studies
Key Resources
Related Resources
Advancing Health Podcast
Case Studies
Case Studies
Letter/Comment
Case Studies